LLM Drift & Quality Decay Part 2: Engineering Drift Detection: Building Early Warning Systems for GenAI Quality
Detecting drift requires semantic observability, not infrastructure monitoring. Here’s the engineering playbook.

In Part 1, we explained the paradox of GenAI systems: LLMs degrade silently even when nothing inside your product changes.
This part covers the engineering foundation needed to detect this decay early - ideally before users notice anything wrong.
If Part 1 exposed the problem, Part 2 is all about the instrumentation, telemetry and evaluative scaffolding required to monitor quality in a non-stationary system.
This isn’t about building a giant evaluation department. It’s about establishing a minimal, high-leverage drift detection framework that works reliably in real-world pipelines.
Drift Cannot Be Detected With Traditional Monitoring
Most enterprises look at:
Model latency
Token usage
Error rates
API failures
Container metrics
Memory & CPU
All of these are useful - but none of them capture the semantic behavior of a GenAI system. Because drift isn’t a system-level anomaly. It’s a behavioral anomaly.
Examples:
The answer is still syntactically correct, but the grounding is gone.
The model is still responsive, but the tone is suddenly over-cautious.
Retrieval is still returning chunks, but they’re subtly less relevant.
The format hasn’t changed, but correctness has dropped 12%.
This is why GenAI observability must be built around evaluation signals, not infrastructure metrics.
The Practical Drift-Detection Architecture
Production Pipeline (Top Row)
User → Query → Retrieval → Prompt → Inference → Post-Process → Response
Each component emits telemetry into:
Semantic Observability Pipeline:
(Query, Retrieval, Prompt, Inference, Post-Process) → Telemetry Collector → Metric Aggregator → Drift Engine → Dashboard → Governance Loop
This architecture mirrors the “Telemetry Bus” design from your Scaling trilogy - but specialized for semantic drift signals, not service health.
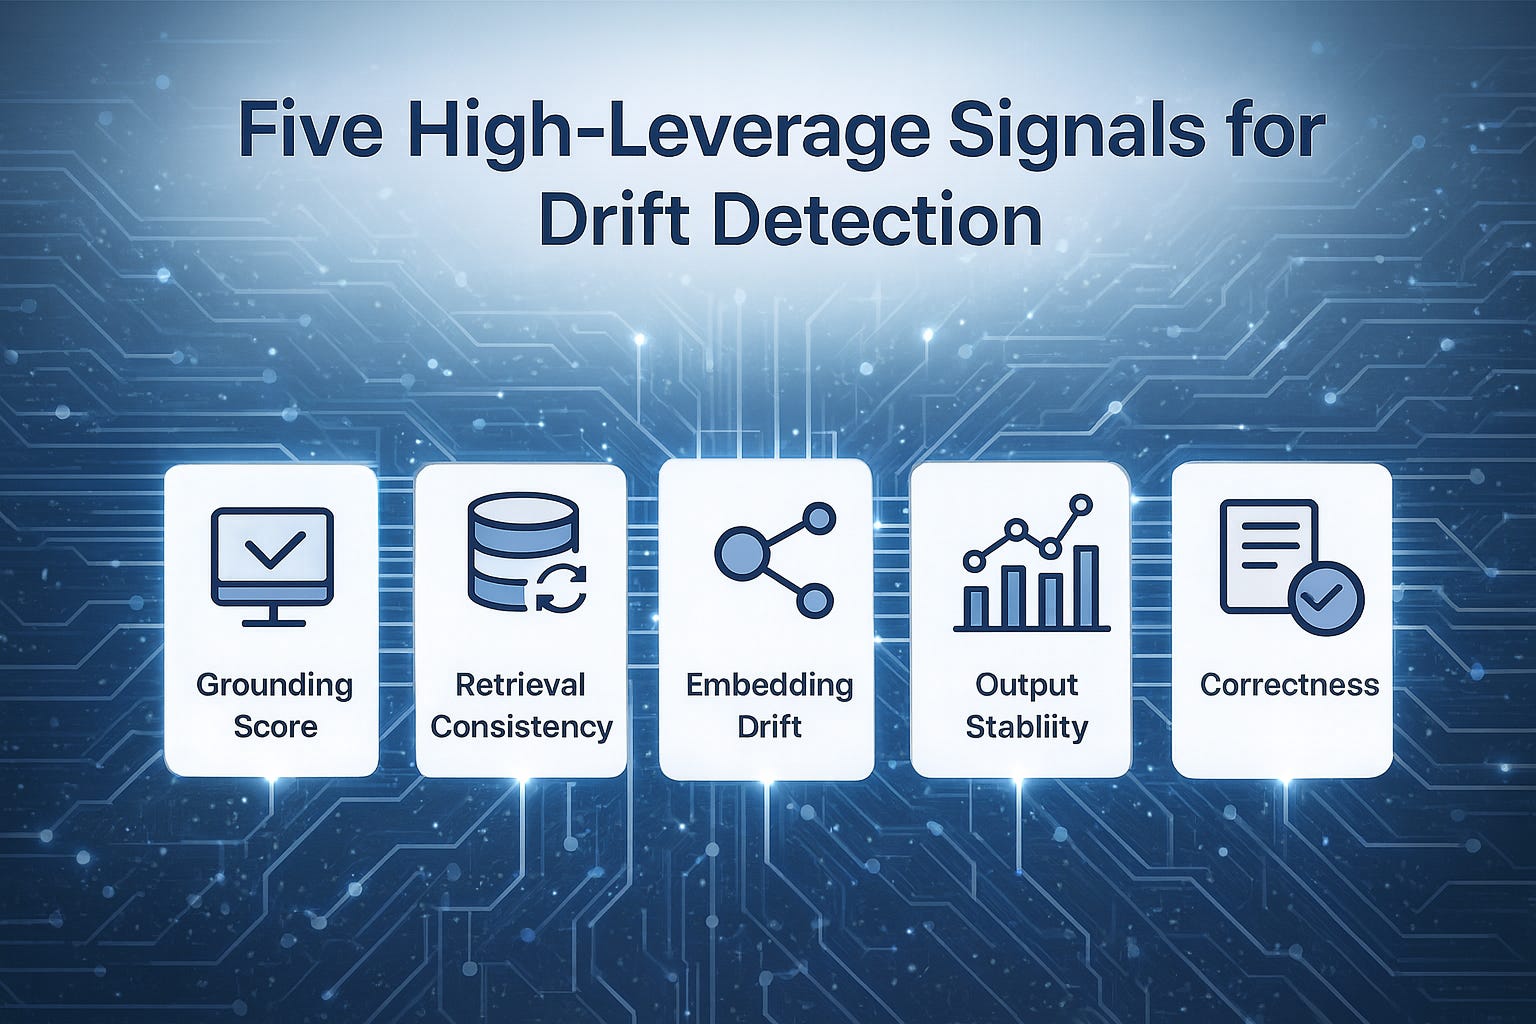
The Five High-Leverage Signals for Drift Detection
Through multiple discussions with GenAI practitioners, the following signals consistently prove to be the highest signal-to-noise ratio.
Grounding Score (Primary Early Warning Signal)
Definition: How well the model’s answer aligns with retrieved evidence.
Why It Works: Grounding drops before correctness drops - making it an ideal early-drift indicator.
How to Measure:
Embedding similarity between answer and documents
or LLM-as-judge scoring
or hybrid (fast filter → judge)
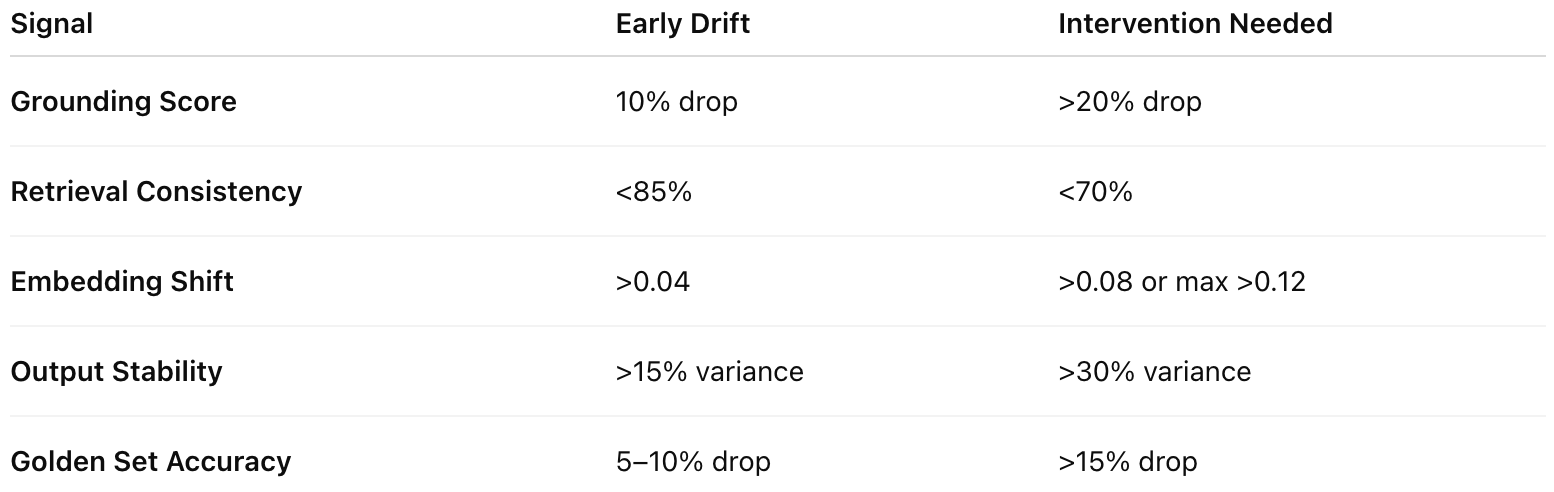
Thresholds:
10% decline over a week → early drift
>20% decline → significant misalignment
Retrieval Consistency (The Canary of Embedding Drift)
Definition: Given the same query, are we retrieving the same chunks today that we retrieved a week ago?”
Implementation:
Maintain “anchor queries” (10-50 queries common across users)
Track top-k consistency
Compute overlap metrics (Jaccard, set similarity)
Why It Works: If embeddings drift or the index ages, retrieval consistency collapses quietly.
Thresholds:
<85% overlap → mild retrieval drift
<70% overlap → severe drift
This can save enterprises from catastrophic RAG degradation.
Embedding Drift (Vector Space Stability)
Embedding drift is the root cause of many mysterious failures.
How to Measure:
Maintain a fixed set of 500–2000 “anchor texts.”
Re-embed them weekly.
Compute:
average cosine shift
max cosine shift
cluster displacement
Thresholds:
Avg shift > 0.04 → drift
Avg > 0.08 or max > 0.12 → index is misaligned
Output Stability (Format + Tone + Structure)
Definition: How consistent the output structure remains for identical inputs.
Drift Symptoms:
Shorter or longer answers
Different tone or sentiment
More disclaimers
More refusals
Format drift (e.g., JSON suddenly unstable)
How to measure:
Compute the variance of:
Length
Sentiment score
Json error rate
Refusal rate
Any other critical business metric
Then, compute the weighted average of the variances.
Thresholds:
>15% variance → early
>30% variance → intervention required
Correctness (Golden Set Evaluation)
Golden sets are the backbone of mature drift detection.
Golden Set Requirements: They must include:
High-business-impact tasks
Common FAQ queries
Edge cases
Compliance-sensitive prompts
User-reported past failures
Red-team style tests
Evaluation Method:
Periodic batch scoring (daily/weekly)
LLM-as-judge
Rubric-based scoring
Deterministic scoring for structured outputs
Thresholds:
5-10% drop → early quality decay
>15% drop → intervention required
Correctness is where leadership notices decay first; grounding is where engineers see it first.
The Drift Engine: What It Actually Does
A Drift Engine contains a set of recurring jobs and evaluators. It typically performs:
Continuous Canary Evaluation
Anchor queries
Daily/hourly checks
Embeddings + retrieval comparison
Scheduled Golden Set Evaluations
Correctness scores
Grounding scores
Consistency scores
Embedding Vector Comparisons
Drift signatures
Cluster purity checks
Retrieval Index Monitoring
New vs old chunk distribution
Metadata aging
Relevance decay
Multi-Model Cross-Scoring
Use a secondary model (or lower-tier LLM) to evaluate:
Hallucination
Safety
Refusal patterns
Factual grounding
Weekly Drift Summary
Aggregated into:
Human-readable dashboard
Qualitative drift notes
Trends (7, 14, 30 days)
This sets the foundations for QRI in Part 3.
Drift Thresholds: Practical Action Guidance
The thresholds in this guide combine (1) empirical observations from real enterprise GenAI deployments and (2) patterns validated in recent research on embedding drift, retrieval degradation, and semantic instability. Studies show that small changes in embedding geometry can cause large shifts in nearest-neighbor rankings (Filippova & Samuylova, 2023; Li & Li, 2023), and that LLM outputs exhibit measurable instability in tone, sentiment, and factual grounding over time (Richardson et al., 2025).
In practice, teams consistently see that cosine shifts above 0.04 begin to reorder top-k retrievals, while shifts above 0.08-0.12 correspond to full cluster reorganization. Similarly, retrieval-overlap drops below 85% correlate with grounding instability, and drops below 70% strongly correlate with RAG misalignment. Grounding and correctness deltas in the 10-20% range reflect the earliest statistically stable indicators of quality decay across semantic tasks, and output stability variance of 15-30% marks clear user-visible drift.
These ranges reflect shared patterns, not universal laws - but they offer reliable, high-sensitivity guardrails for practical drift detection in production LLM systems.
What Most Teams Misunderstand
A recurring misconception:
“If we don’t change anything, quality should stay stable.”
This is false.
LLMs are non-stationary, especially when:
Providers deploy silent updates
Embeddings evolve
World knowledge changes
Safety filters drift
Teams ingest new documents
User-query distribution shifts
Drift emerges from the environment - not from code.
What’s Next in This Series
Part 3 introduces QRI - Quality Reliability Index. A governance-grade metric that synthesizes:
Correctness
Grounding
Consistency
Drift risk
User quality
….into a single KPI.
This gives leadership a clear answer to: “Is our GenAI system improving or degrading?”
We’re FortifyRoot - the LLM Cost, Safety & Audit Control Layer for Production GenAI.
If you’re facing unpredictable LLM spend, safety risks or need auditability across GenAI workloads - we’d be glad to help.