The Hidden Complexity of Scaling GenAI Systems Part 2: Engineering Observability: Making GenAI Systems Visible and Measurable
Turning hidden behaviour into measurable reliability

Why Logs Aren’t Enough
Part 1 exposed why GenAI systems fail before costs rise, here we discuss how to avoid them. Traditional logs capture crashes, not drift. In GenAI, most failures are semantic: missing context, inflated prompts or silent model downgrade.
Significant LLM outages are rooted in silent failures that standard logging missed.
The Purpose of Observability in AI Pipelines
Observability is not about collecting data; it’s about connecting events across layers so teams can answer one critical question:
“When a response is slow or nonsensical, which stage broke and why?”
An observability framework for GenAI must therefore measure retrieval, prompt, inference, and response layers as one system.
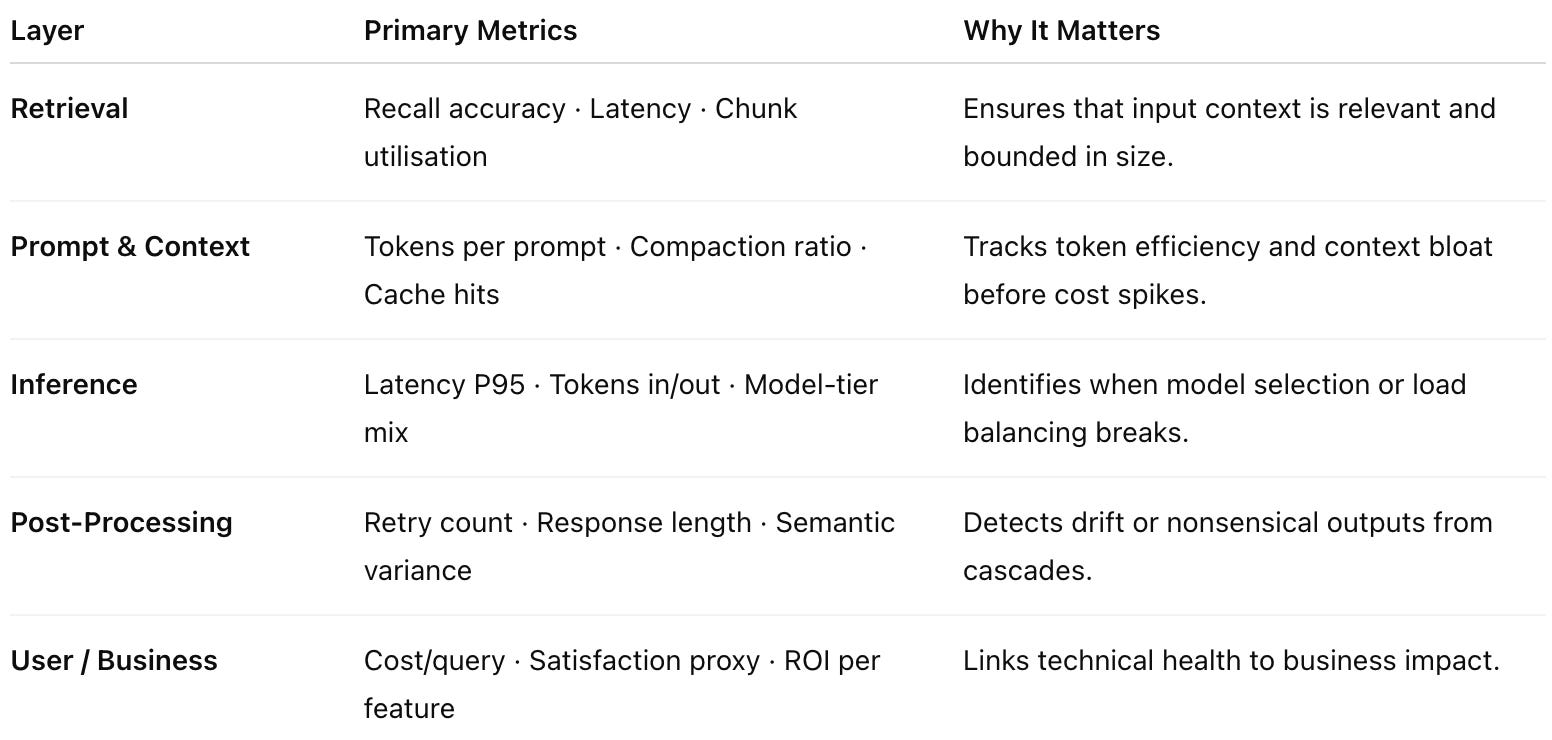
What to Measure
Functional Building Blocks of Observability
To remain vendor-neutral, FortifyRoot defines observability as five core functions every AI platform must implement:
Telemetry Collectors: Capture structured events from retrieval, inference, and response stages. Each event must include a correlation ID to trace a single user query across systems.
Metric Aggregators: Normalise disparate logs (token counts, GPU load, latency) into a consistent schema for querying and trend analysis.
Distributed Tracers: Propagate unique trace IDs throughout the pipeline so a complete call chain can be reconstructed - from vector retrieval to model completion.
Visualization Dashboards: Expose KPIs (cost/query, latency, token growth, recall variance) to engineering and business stakeholders in real time.
Anomaly Engines: Automatically detect deviation from expected behaviour - e.g., token per query ↑ 30%, latency ↑ 2x, recall ↓ 10%. Trigger alerts and initiate governance loops for review.
Together these form the nervous system of GenAI reliability.
Reference Architecture
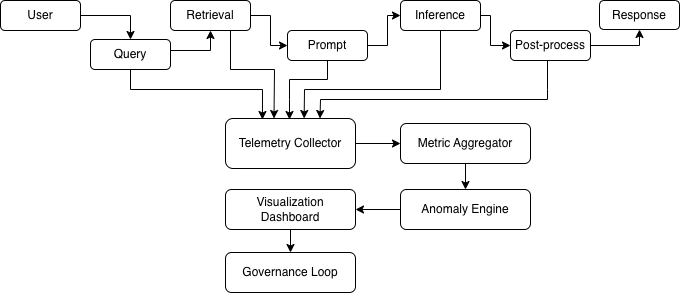
This “telemetry bus” turns every request into measurable cost, latency, and correctness - data that feeds directly into FinOps and governance.
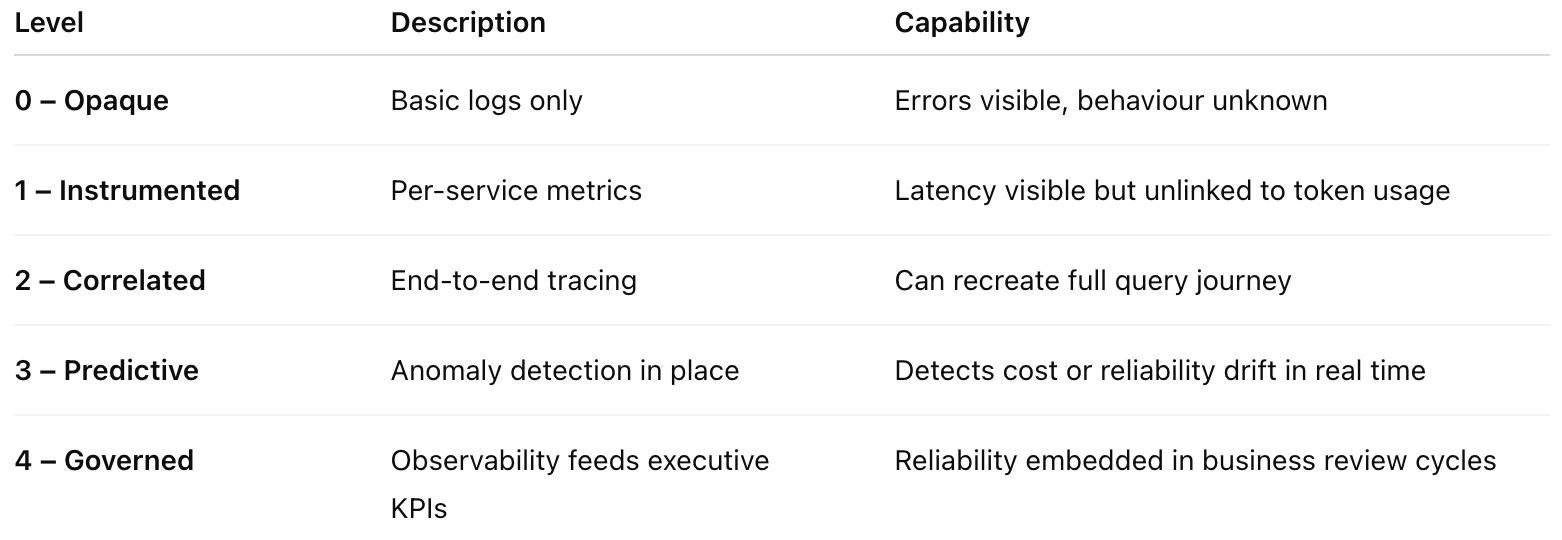
Maturity Model for Observability
Most SMEs today sit between Level 1 and 2 - visibility exists, correlation does not.
Implementation Checklist
✅ Define event schemas for retrieval, prompt, inference.
✅ Propagate correlation IDs across services.
✅ Aggregate metrics by feature and user session.
✅ Visualise latency and token growth over time.
✅ Automate alerts for threshold breaches.
✅ Review observability reports in governance meetings.
Key Takeaways
Observability is a design requirement, not a debug tool.
Reliability and cost cannot be managed without shared telemetry.
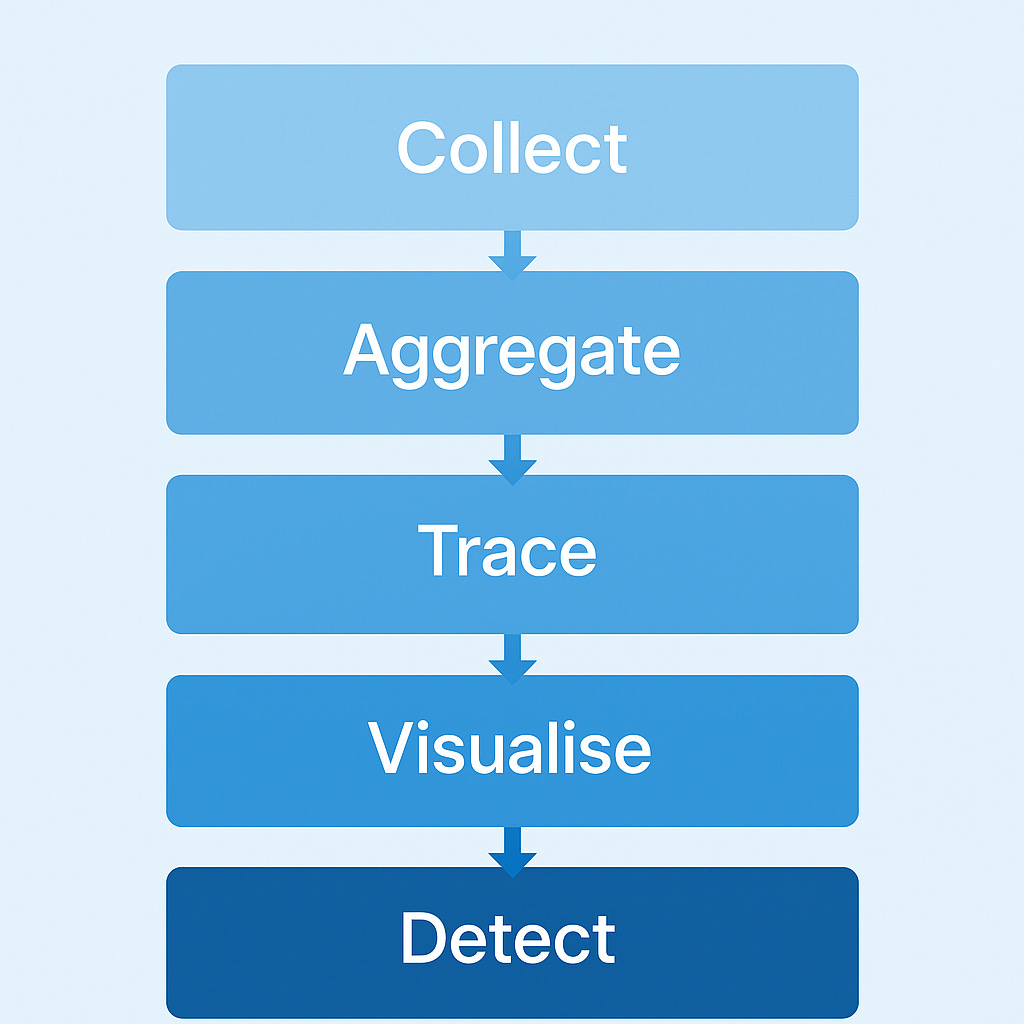
Five core functions - collect, aggregate, trace, visualise, detect form the basis of AI observability maturity.
Mature observability directly reduces incident response time and unplanned spend.
What’s Next in the Series
You’ve now seen how observability connects every layer of a GenAI pipeline - retrieval, prompt, inference and response - into a single measurable system. In Part 3, we’ll zoom out to the leadership level. We’ll show how CTOs and platform heads can formalise these insights through AI Reliability Governance, turning uptime, correctness, and cost predictability into measurable KPIs under one framework - the AI Reliability Index (ARI).
We’re FortifyRoot - the LLM Cost, Safety & Audit Control Layer for Production GenAI.
If you’re facing unpredictable LLM spend, safety risks or need auditability across GenAI workloads - we’d be glad to help.