LLM Drift & Quality Decay Part 3: Quality Reliability Index(QRI) - A Governance Framework for Long-Term GenAI Stability
Drift is inevitable - governance is not. QRI turns GenAI quality into a measurable, trackable, leadership-ready KPI.

In Part 1, we exposed the silent failure mode of GenAI systems: LLM Drift.
In Part 2, we covered the engineering playbook needed to detect that drift before users notice.
This final chapter answers the most important leadership question:
“How do we make GenAI quality measurable, governable and predictable?”
For enterprises, GenAI is no longer a toy side-feature - it is becoming a product dependency. But without a stable way to measure quality over time, AI reliability remains an intuition rather than a KPI.
That’s why we propose a unifying metric:
QRI - Quality Reliability Index
A 0.0–1.0 composite score that captures the long-term semantic reliability of your GenAI system across correctness, grounding, consistency, drift risk and user quality.
This is the quality equivalent of:
SRE’s error budgets
API teams’ SLAs
Cybersecurity’s risk scoring
Data governance’s lineage health metrics
QRI turns GenAI quality from an anecdotal observation into a measurable, trackable performance indicator.
Why Leadership Needs a Quality KPI
Without a quality metric, drift manifests as:
Rising user complaints
Inconsistent summarizations
Hallucinations emerging in edge cases
Refusal rates creeping upward
Unexplained variability in tone or format
Degraded retrieval
Broken grounding
But these appear weeks after the underlying drift begins.
Executives, product managers and engineering leaders need:
A single place to observe quality
A trend line to understand movement
A threshold to determine intervention
A shared language across engineering and product
A way to evaluate impact of model changes
A governance loop for long-term reliability
QRI solves for all these needs.
QRI Components: A Complete but Practical Set of Signals
QRI synthesizes five components. All are already being captured in drift detection (Part 2); QRI simply elevates them into a leadership dashboard.
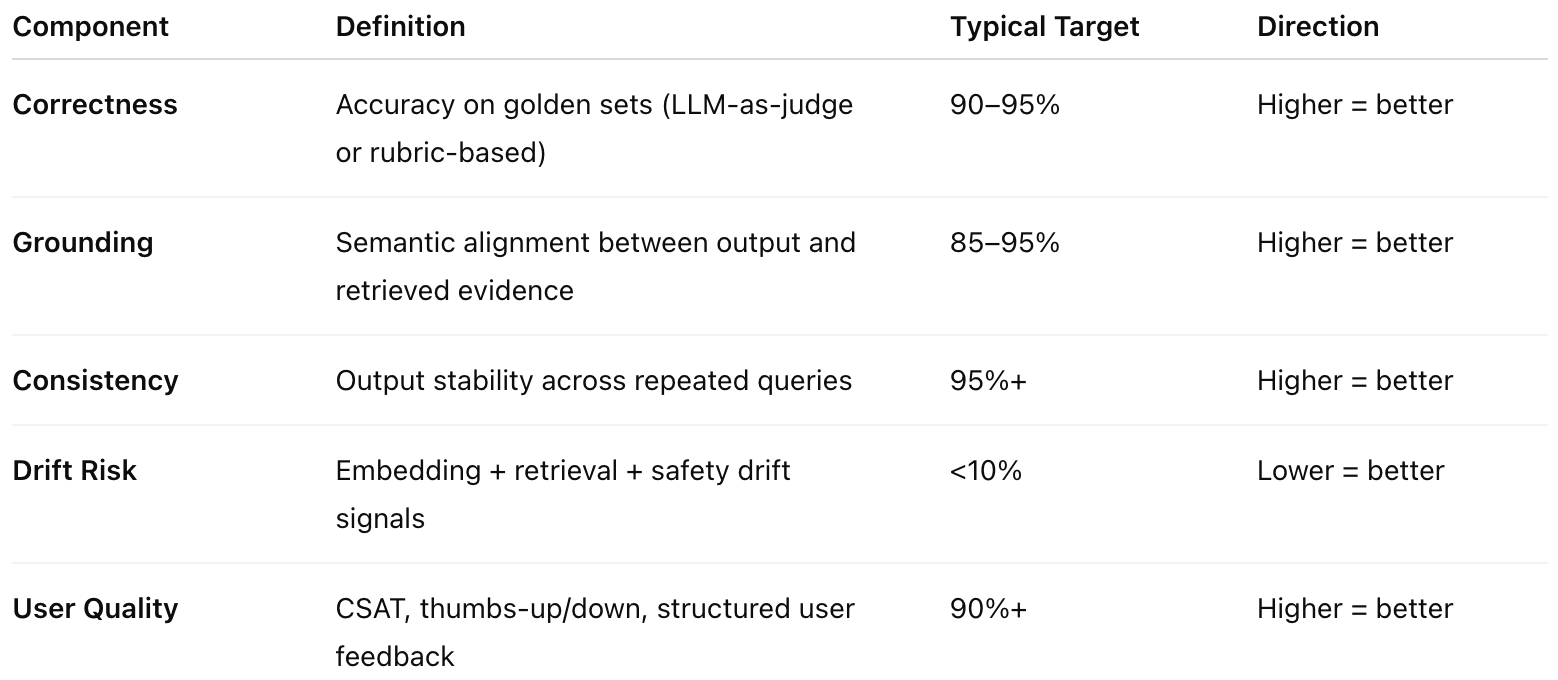
These five dimensions cover the entire semantic lifecycle:
evidence → processing → output → stability → user impact.
How to Normalize the Signals (Engineering Formula)
Each component is normalized to the 0-1 range.
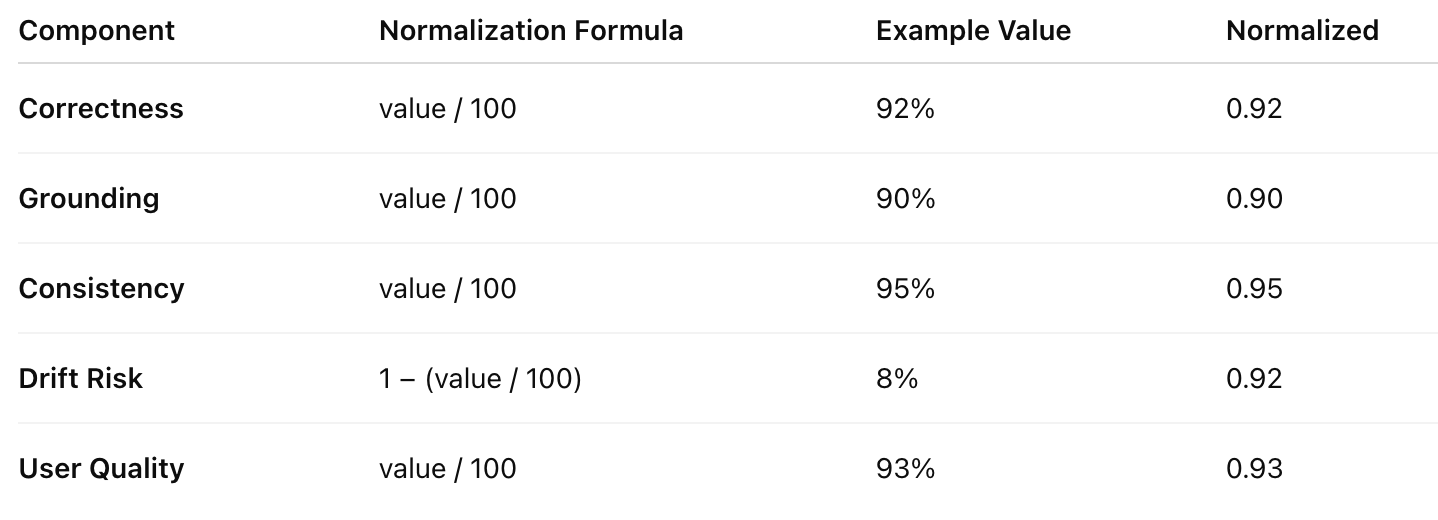
Aggregate (unweighted) QRI:
QRI = (0.92 + 0.90 + 0.95 + 0.92 + 0.93) / 5 = 0.924
But this assumes equal importance.
In reality:
Different sectors need different weightings
Fintech → correctness & grounding > everything else
Healthcare → correctness & safety > consistency
Customer Support → consistency & user quality > grounding
Developer Tools → grounding & consistency > drift risk
LegalTech → grounding & correctness > user quality
Which leads to:
Weighted QRI Variant (Recommended)
QRI = Σ( wᵢ × Nᵢ )
Where:
wᵢ = weight for a component
Nᵢ = normalized score (0–1)
Weights must sum to 1.
Example weights(for Fintech):
Correctness: 0.30
Grounding: 0.30
Consistency: 0.15
Drift Risk: 0.15
User Quality: 0.10
The weighted version becomes far more reflective of business reality.
Important Note:
As mentioned earlier, a good LLMOps platform should allow defining custom business metrics and weightings. Some enterprises accept slightly lower latency or mild drift but require extremely high correctness. Others prioritize tone stability or safety-critical refusal accuracy.
Quality governance must allow that flexibility.
QRI Interpretation Framework
We mirror the clarity of the scaling trilogy’s ARI framework.
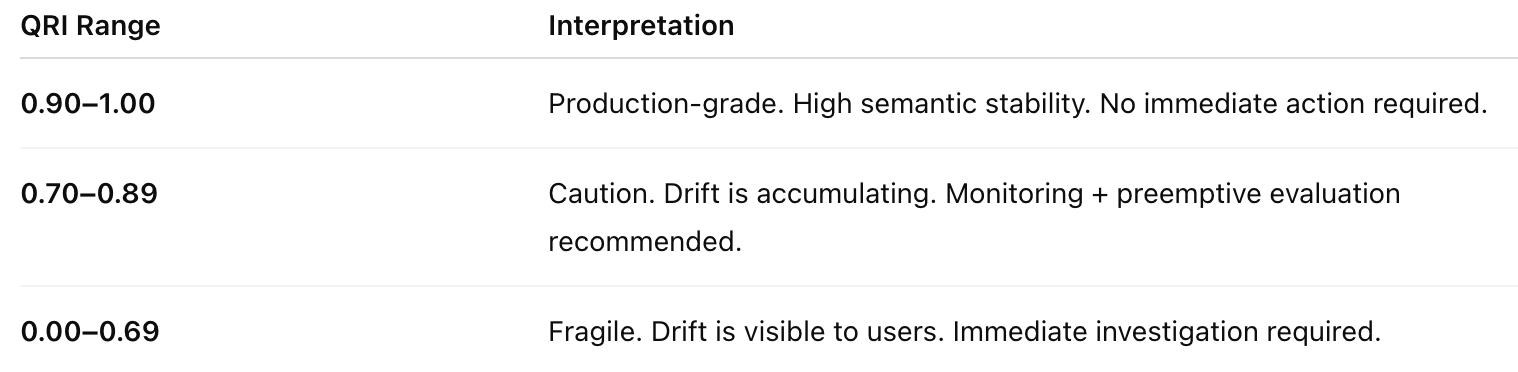
The goal isn’t to push QRI to 1.00 - it’s to keep QRI above threshold.
Same philosophy as SRE SLOs.
The GenAI Quality Governance Loop
Modeled after our “Governance Loop” diagram from the scaling trilogy:
Weekly
QRI snapshot
Drift signal summary
Top regressions
Grounding/consistency deviations
Safety/refusal anomalies
Monthly
Golden set refresh
Retrieve new compliance docs
New anchors for embedding drift
Test new provider versions
Quarterly
Recalibration of weights
Domain vocabulary update
Indexing strategy refresh
Safety policy alignment audit
Annually
Full quality posture review
Provider migration evaluation
New architecture recommendations
QRI becomes the scoreboard for this entire loop.
Why QRI Works
Because QRI blends:
Model-behavior signals
RAG-specific signals
User-feedback signals
Embedding stability
Drift risk
Groundedness
Correctness
No single metric captures semantic reliability. A composite does.
Final Takeaway
Drift is unavoidable. Quality decay is inevitable. But governance is not optional.
QRI gives your team a single, unifying metric to capture the health of your GenAI system - and the clarity to intervene before degradation becomes visible to customers.
We’re FortifyRoot - the LLM Cost, Safety & Audit Control Layer for Production GenAI.
If you’re facing unpredictable LLM spend, safety risks or need auditability across GenAI workloads - we’d be glad to help.
Thanks for writing this, it clarifys the governance need.